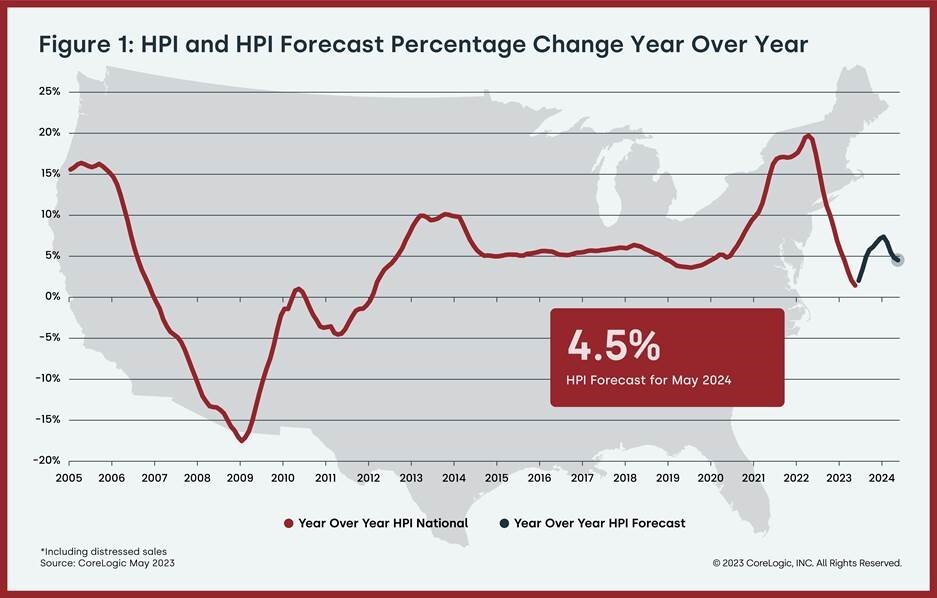
Based on CoreLogic’s latest Home Price Index for May 2023, annual U.S. single-family home price growth slowed for the 12th straight month in May, falling to 1.4% increase year over year. The last time CoreLogic’s Home Price index saw annual growth fall to less than 2% was in early 2012, but U.S. appreciation still remained positive for the 136th straight month in May.
Following recent trends, a significant number of Western states saw prices decline in May from the same time in 2022, reflecting out-migration from less-urban locations where people moved during the height of the pandemic and the significant loss of affordability due to those resulting home price surges. Northeastern states and Southeastern metro areas continue to see larger home price gains compared with other areas of the country, due to both workers slowly moving back to job centers in some areas of the country and settling in relatively affordable places in others.
“After peaking in the spring of 2022, annual home price deceleration continued in May,” said Selma Hepp, chief economist at CoreLogic. “Despite slowing year-over-year price growth, the recent momentum in monthly price gains continues in the face of recent mortgage rates increases.”
“Nevertheless, following a cumulative increase of almost 4% in home prices between February and April of 2023, “Hepp continued, “elevated mortgage rates and high home prices are putting pressure on potential buyers. These dynamics are cooling recent month-over-month home price growth, which began to taper and is returning to the pre-pandemic average, with a 0.9% increase from April to May.”
Top U.S. Housing Market Takeaways:
- U.S. home prices (including distressed sales) increased by 1.4% year over year in May 2023 compared with May 2022. On a month-over-month basis, home prices increased by 0.9% compared with April 2023.
- In May, the annual appreciation of attached properties (2.7%) was 1.7 percentage points higher than that of detached properties (1%).
- CoreLogic forecasts show annual U.S. home price gains increasing to 4.5% by May 2024.
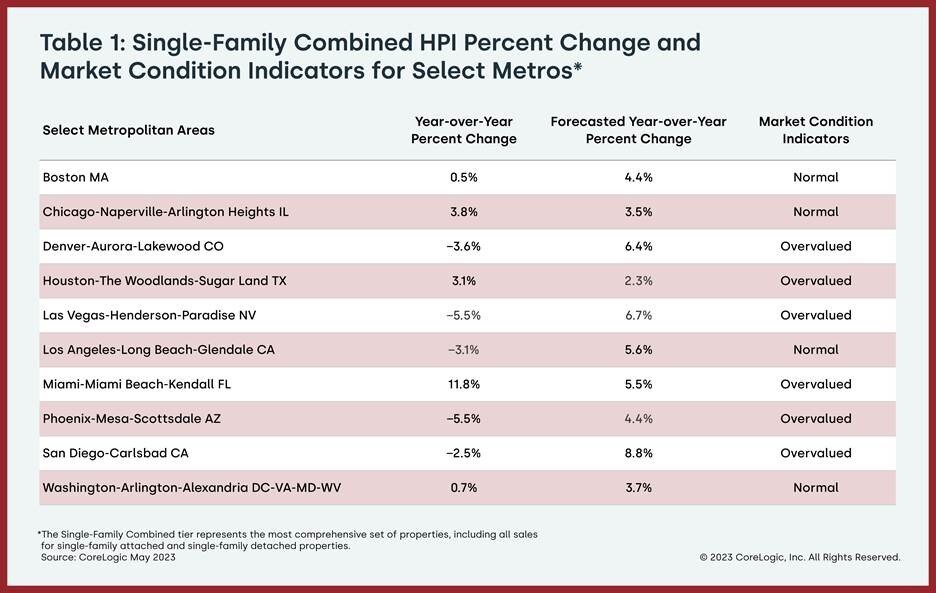
- Miami again posted the highest year-over-year home price increase of the country’s 20 tracked metro areas in May, at 11.8%. Atlanta and Charlotte, North Carolina saw the next-highest gains, both at 4.4%.
- Among states, Maine ranked first for annual appreciation in May (up by 7.2%), followed by New Jersey (up by 7.1%) and Indiana (up by 6.9%). Eleven states and one district recorded annual home price losses: Idaho (-8%), Washington (-7.5%), Nevada (-5.6%), Montana (-5.3%), Utah (-4.3%), Arizona (-4.2%), California (-3.5%), Oregon (-3.1%), Colorado (-2.7%), South Dakota (-1.3%), New York (-0.3%) and the District of Columbia (-0.1%).


